
Golden Cross and Death Cross Trading: A Simple Guide
What happens when two moving averages cross? Learn how to identify golden and death crosses, build a conditional trading plan, and understand why crossover signals can fail.

In the previous article, we introduced moving averages: lines that help simplify price movements. This time, we will look at what happens when two moving averages with different periods cross.
When the shorter-period line crosses above the longer-period line, it is called a golden cross. When it crosses below, it is called a death cross. Start with one simple question: which line crossed, and in which direction?
1. What Are Golden and Death Crosses?
A shorter-period moving average uses a shorter calculation period than a longer-period moving average. For example, when comparing a 20 SMA with a 50 SMA, the 20 SMA is the shorter-period line.
| Pattern | What happens | Common interpretation |
|---|---|---|
| Golden cross | The shorter-period line crosses above the longer-period line | A possible shift toward an upward trend |
| Death cross | The shorter-period line crosses below the longer-period line | A possible shift toward a downward trend |
The terms are commonly associated with the 50-day and 200-day moving averages. They are also used for other settings, so always check the chart timeframe, periods, and calculation method.
Remember that price crossing a moving average is different from two moving averages crossing each other. This article focuses on the second situation.
2. How to Check a Crossover
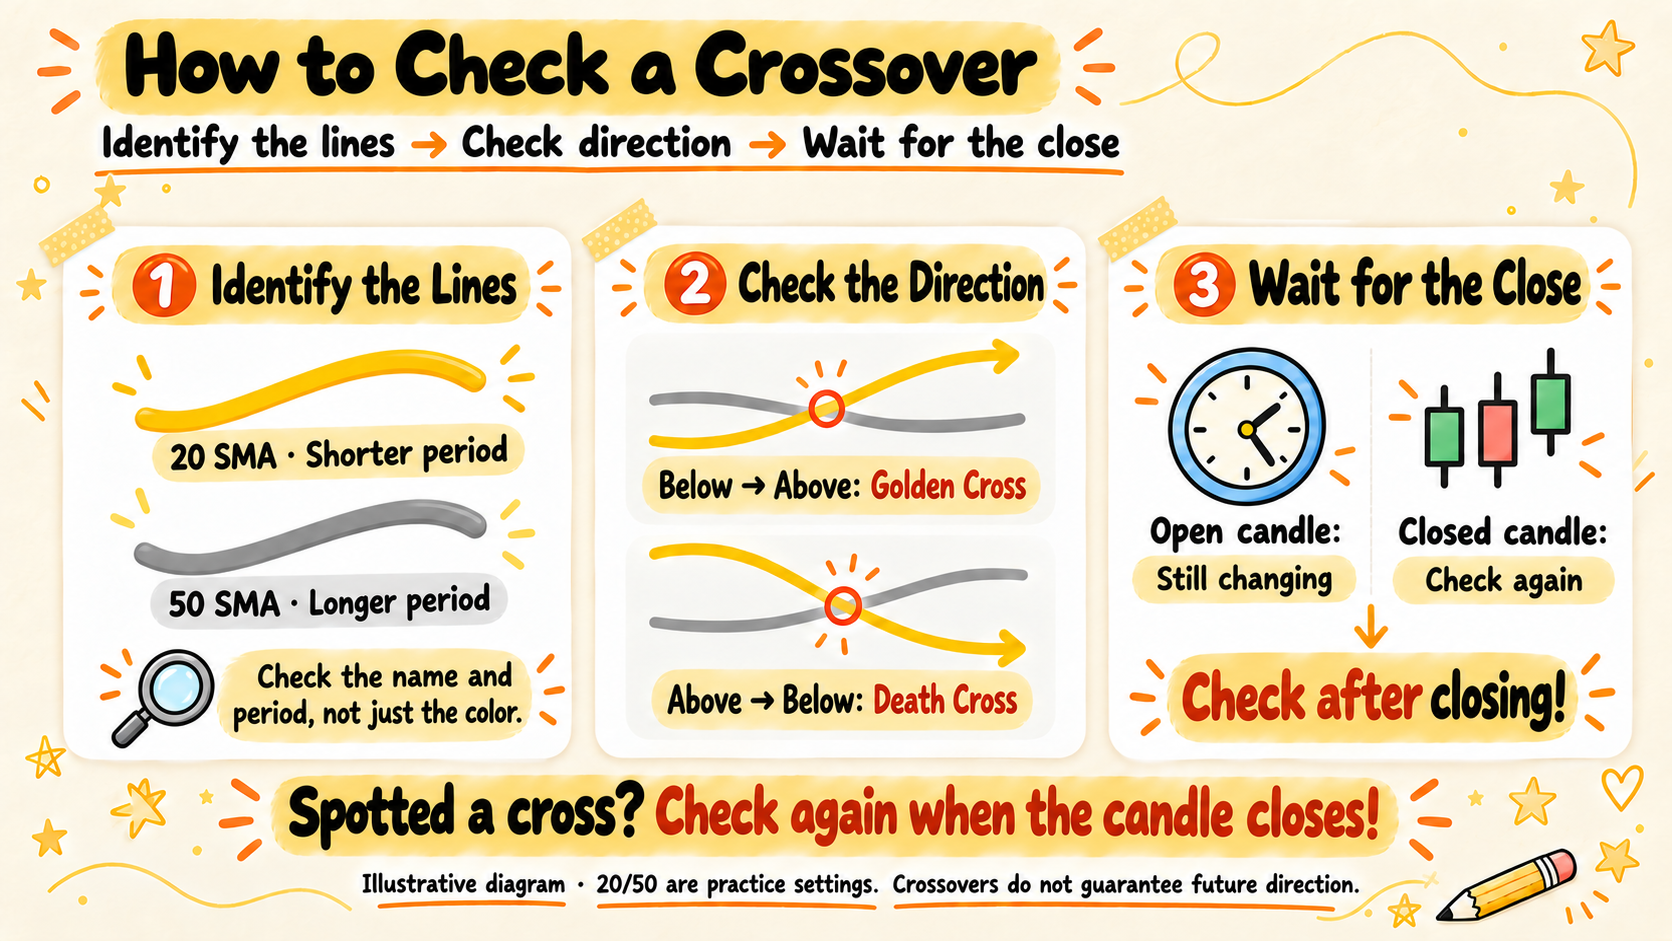
① Identify Each Line
For practice, make the 20 SMA yellow and the 50 SMA gray. The colors are your choice; what matters is knowing which line represents each period. The 20 and 50 settings here are teaching examples, not optimized parameters.
② Compare Their Order Before and After
If the yellow 20 SMA was below the gray 50 SMA on the previous candle but is above it on the next, you have identified an upward crossover. If the shorter-period line moves from above to below, you have identified a downward crossover.
③ Check Again After the Candle Closes
During an unfinished candle, prices and moving average values can change. A temporary crossover may disappear before the candle closes. Recording observations from completed candles makes your practice more consistent, although waiting for the close does not guarantee the next price direction.
3. Does a Crossover Mean You Should Trade?
A crossover is one observation. It does not provide a complete plan for entry, exit, or risk management. Add these questions to your practice notes.
| Question | What to record |
|---|---|
| Which direction are the lines pointing? | Whether each line is rising, falling, or roughly flat |
| Have crossovers been repeating? | How often their order has recently reversed |
| Has price already moved a long way? | The distance between a possible entry and the planned stop |
For example, you might write: “An upward crossover appeared, but both lines are nearly flat and recent crosses have repeatedly reversed.” This describes the situation more clearly than simply writing “golden cross—buy.”
4. An Illustrative Trading Plan
The following is a fictional educational example showing how a crossover might fit into a plan. It is not a live recommendation or a strategy with verified profitability.
① Define Observation and Entry Conditions
This example first requires the 20 SMA to cross above the 50 SMA on a completed candle, followed by both lines rising. The plan then waits for a pullback and a rebound. An entry is considered only if price breaks above the rebound candle’s high. If those conditions do not occur, the plan produces no trade.
② Set the Stop and Target First
Assume the conditions occur and a hypothetical purchase fills at 100. The example places a stop reference at 98, below the recent pullback low, and a target at 104, near a previous high.
| Item | Fictional price |
|---|---|
| Buy fill | 100 |
| Stop reference | 98 |
| Target exit | 104 |
| Planned risk-to-reward ratio | 2 units of risk to 4 units of reward: 1:2 |
A stop is intended to limit a loss when the trade moves against the plan. This example could reach its stop without reaching its target. A planned 1:2 ratio alone does not establish profitability.
③ Record Unsuccessful Trades Honestly
If the stop condition is reached, record a failed example under the original rules. Moving the stop farther away to avoid accepting a loss creates a different plan. Actual results depend on position size, contract specifications, costs, and execution. A stop order does not guarantee a fill at its specified price.
5. Why Crossover Signals Can Fail
Price Is Moving Sideways
When prices move back and forth within a range, the lines can cross repeatedly. Trading every crossover may produce repeated losses and transaction costs. A practice plan can include conditions for staying out of the market.
Price Has Already Moved
Moving averages are lagging indicators: they are calculated from prices that have already occurred. By the time a crossover appears, part of the move may be over. Identifying a crossover and deciding whether the current entry offers acceptable risk are separate tasks.
Key Takeaways
A golden cross is an upward crossover by the shorter-period line; a death cross is a downward crossover. Check the timeframe, settings, and candle-close status. A complete trading plan also needs entry conditions, stop and exit rules, and situations in which no trade is taken.
Frequently Asked Questions
Does a Golden Cross Guarantee a Rally?
No. Price can fall after the crossover, and the lines may cross back. The pattern does not determine future prices.
Is 20/50 Better Than 50/200?
There is no universally superior setting. Start with fixed parameters and compare successful and unsuccessful examples using the same rules.
Should I Sell Immediately After a Death Cross?
A crossover alone is not enough to decide. Consider the product, your trading objective, and your predefined risk-management rules.
Next: Moving Average Pullback Trading
If price dips after a crossover, is the upward move over, or is it a temporary pullback? The next article explains how to observe a pullback and define conditions that would invalidate an upward-trend interpretation.
Educational Purpose and Risk Disclosure
This article provides general information and education. It is not a recommendation to buy or sell a financial instrument or personalized investment advice. Fictional examples and indicator interpretations do not guarantee future returns.
Leveraged trading involves substantial risk. Depending on the product and applicable protections, losses may exceed the initial investment. Understand the structure, costs, and risks before trading. This disclosure does not exclude liability that cannot lawfully be excluded.