
Moving Average Trading: SMA vs. EMA and How to Read Trends
Moving averages help simplify price movements and identify trends. Learn the differences between SMA and EMA, how to set them up in MT5, and how to build a conditional trading plan using an illustrative example.
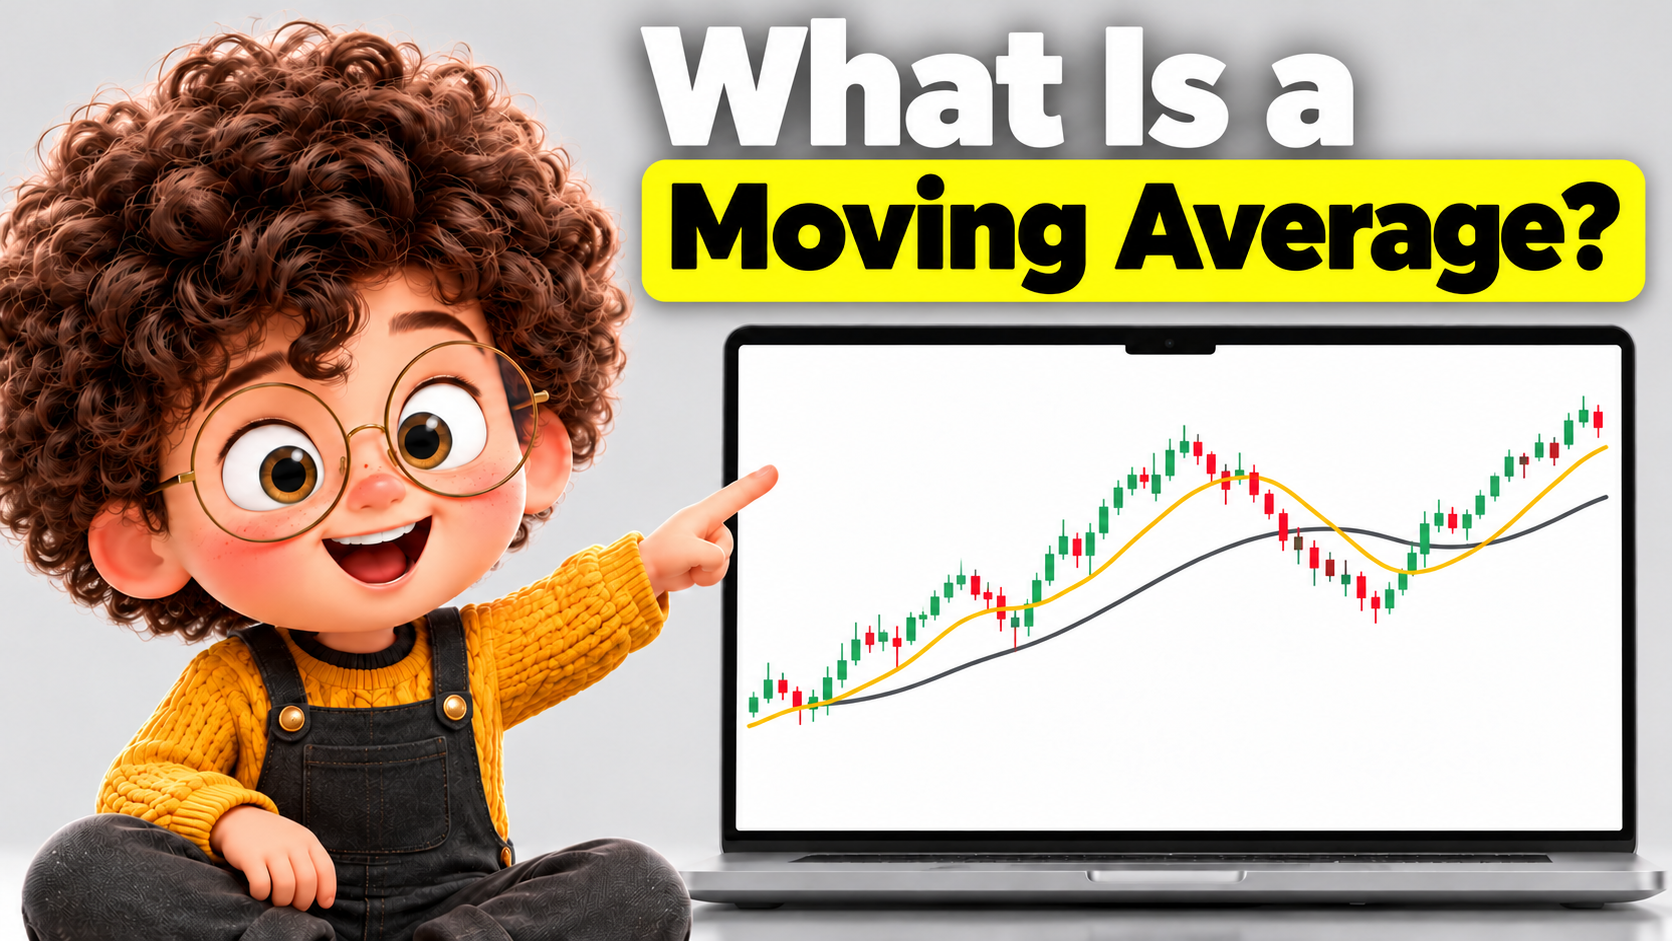
A chart filled with candlesticks can make the market’s direction difficult to see. Small rallies and declines often overlap, especially over shorter periods.
A moving average helps simplify that movement by turning a series of prices into a smoother line.
In this guide, you will learn how moving averages work, how SMA and EMA differ, and how to add them to MetaTrader 5. We will then walk through an illustrative trading plan, including conditions that would invalidate it.
What Is a Moving Average?
A moving average, or MA, combines price observations into an average or weighted average that updates over time.
For example, a closing-price SMA uses the closing prices of a specified number of candles. A new candle changes the calculation.
The period refers to candles on the selected chart. A 20-period setting does not always mean 20 days.
| Chart timeframe | What a 20-period SMA uses |
|---|---|
| Daily | The latest 20 daily candles |
| 4-hour | The latest 20 four-hour candles |
| 1-hour | The latest 20 hourly candles |
| 15-minute | The latest 20 fifteen-minute candles |
When comparing settings, check the timeframe, calculation method, and price source alongside the period.
SMA vs. EMA: What Is the Difference?
Simple Moving Average: SMA
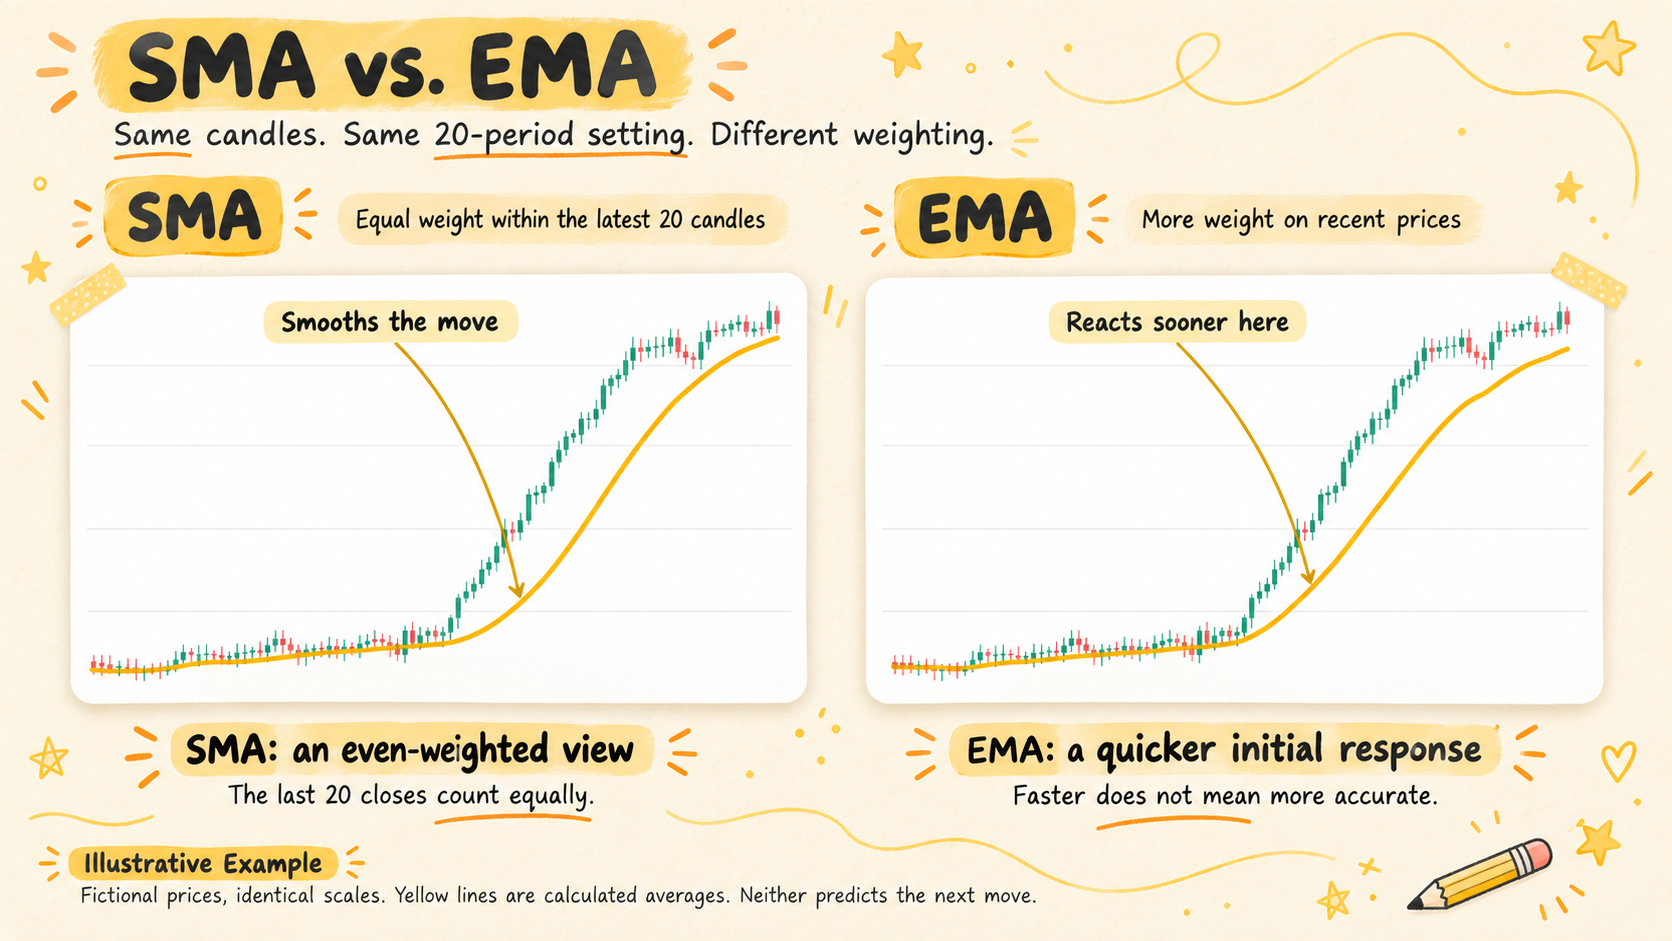
An SMA gives equal weight to each price within its calculation window.
Suppose five fictional closing prices are:
100, 102, 104, 102, and 107.
The five-period SMA is:
(100 + 102 + 104 + 102 + 107) ÷ 5 = 103
When another candle is added, the oldest value drops out of the calculation.
Exponential Moving Average: EMA
An EMA gives greater weight to recent prices. Compared with an SMA of the same period, it generally reacts more quickly to recent changes.
A faster response does not automatically mean better accuracy or higher returns.
| Feature | SMA | EMA |
|---|---|---|
| Weighting | Equal within the calculation window | Greater weight on recent prices |
| Response to recent changes | Generally slower | Generally faster |
For practice, place both on the same chart using the same period and price source. Observe how their paths differ after a sharp price change.
A Practical Checklist for Reading Moving Averages
Instead of treating every crossing as a trade signal, use a consistent observation checklist.
1. Record Where Price Is Relative to the Line
Is price above or below the moving average? Did it briefly cross during the candle, or did the candle close on that side?
Record the distinction. The current candle and its moving average value can change before the candle closes.
2. Describe the Line’s Direction
Write down whether the line is rising, falling, or roughly flat.
For example, your notes might say:
“Price closed above the line, but the line remains flat.”
That description is more precise than simply writing “bullish.”
3. Separate Alignment From Price Location
With several moving averages, record their order separately from the current price.
For this article’s practice exercise, use 20-, 50-, and 200-period averages. Note which is highest and which is lowest, then separately record the direction of each line.
These settings are teaching examples, not recommended or optimized parameters.
How to Add a Moving Average in MT5
In desktop MetaTrader 5, use the Insert menu to add an indicator, or locate Moving Average in the Navigator and apply it to your chart.
Menu wording may differ by language or version.
Start with this comparison setup:
| Setting | Practice value |
|---|---|
| Period | 20 |
| Shift | 0 |
| MA method | Simple |
| Apply to | Close |
Add a second Moving Average and change its method to Exponential. Use different colors to distinguish them.
You can modify an existing indicator through its properties or the Indicator List.
An Illustrative Moving Average Trading Plan
The following example shows how to turn observations into conditional rules.
It is fictional. It is not live market analysis, a tested strategy, or evidence of profitability.
Step 1: Define the Observation Conditions
Assume a one-hour chart has a 20 EMA and a 50 EMA.
For this example, the observation conditions are:
- The 20 EMA is above the 50 EMA.
- Both lines are rising.
- Recent price highs and lows are also rising.
Meeting these conditions does not trigger an immediate purchase. It only identifies a situation to examine further.
Step 2: Define What Must Happen After a Pullback
Suppose price returns toward the 20 EMA.
In this fictional plan, touching the line is not enough. The plan requires a candle to close back above the 20 EMA, followed by a break above that candle’s high.
If those conditions do not occur, the example produces no entry.
This is one possible rule set for study, not a claim that these conditions provide an advantage.
Step 3: Define Entry, Stop, and Exit Beforehand
Assume the conditions occur and the hypothetical purchase fills at 100.
| Item | Illustrative plan |
|---|---|
| Entry | Buy fill at 100 after the defined conditions |
| Stop-loss reference | 98, below the pullback low |
| Target exit reference | 104, near the previous high |
| Planned risk per unit | 100 − 98 = 2 |
| Target reward per unit | 104 − 100 = 4 |
| Planned risk-to-reward ratio | 1:2 |
These numbers demonstrate arithmetic only. They do not represent actual Forex or XAUUSD prices, contract specifications, or suitable stop distances.
An exit exactly at 104 would produce a gain of 4 per unit before costs. An exit exactly at 98 would produce a loss of 2 per unit before costs.
Actual results can differ because of spreads, commissions, slippage, and execution conditions. A stop order does not guarantee execution at its specified price.
A planned 1:2 risk-to-reward ratio also does not establish profitability. Losing trades may occur repeatedly, and the target may never be reached.
Step 4: Record Failure Using the Original Rules
If the position reaches the stop condition, record it as a failed example under the original plan.
Moving the stop farther away or changing the moving average period afterward would create a different plan and make the original decision harder to assess.
If price rallies without meeting the entry conditions, record a missed move rather than inventing a retrospective entry.
A plan does not need to participate in every price movement.
Limitations to Understand
Moving averages react to prices that have already occurred. They can help organize trend analysis, but they do not predict future prices.
Crossing signals can also reverse repeatedly in sideways conditions. By the time a clear alignment appears, a substantial price move may already have happened.
Use these limitations as questions in your practice journal:
- Did the example occur during a directional move or a range?
- How far had price already moved before the conditions appeared?
- What was the distance between the proposed entry and invalidation point?
- Would costs materially change the result?
Avoid changing the settings after every losing example. Keep the rules fixed while comparing both successful and unsuccessful cases.
Key Takeaways
- Specify the timeframe, period, calculation method, and price source.
- SMA and EMA weight price observations differently.
- Describe price location, line direction, and alignment separately.
- Define entry conditions and invalidation before evaluating a trade.
- Include losing examples, missed moves, and transaction costs in your records.
- No moving average setting guarantees profitable trading.
Frequently Asked Questions
Is EMA Better Than SMA?
This article does not establish that either method is superior. Compare them under the same predefined conditions rather than choosing whichever looks best on a completed chart.
Which Moving Average Period Should I Use?
The 20-, 50-, and 200-period settings here are teaching examples. They are not universal recommendations. Begin by understanding how changing a period changes what you observe.
Can I Apply This Exercise to XAUUSD?
You can use an XAUUSD chart for observation practice. Do not transfer the fictional example’s price distances or position size directly into a real order.
First check the specific product’s contract size, trading costs, and how price changes translate into account gains or losses.
Does Price Crossing a Moving Average Mean I Should Enter?
A crossing alone does not provide the complete plan used in this article. The illustrative exercise also requires defined observation conditions, entry rules, and an invalidation point.
Next: Golden Cross and Death Cross
What happens when two moving averages cross each other?
The next article explains the golden cross and death cross. We will examine how these patterns are interpreted and why a crossover can be followed by a move in the opposite direction.
Educational Purpose and Risk Disclosure
This content provides general information and education. It is not a recommendation to buy or sell a financial instrument or personalized investment advice. Illustrative examples and indicator interpretations do not guarantee future performance.
Leveraged trading can cause substantial losses. Depending on the product structure and applicable protections, losses may exceed the initial investment. Understand the product, costs, and risks before making an independent decision.
This disclosure does not exclude liability that cannot lawfully be excluded.