
Moving Average Pullback Trading: A Beginner's Guide
Learn how moving average pullbacks work, how to identify potential rebounds, and how to manage risk using a simple trading example.
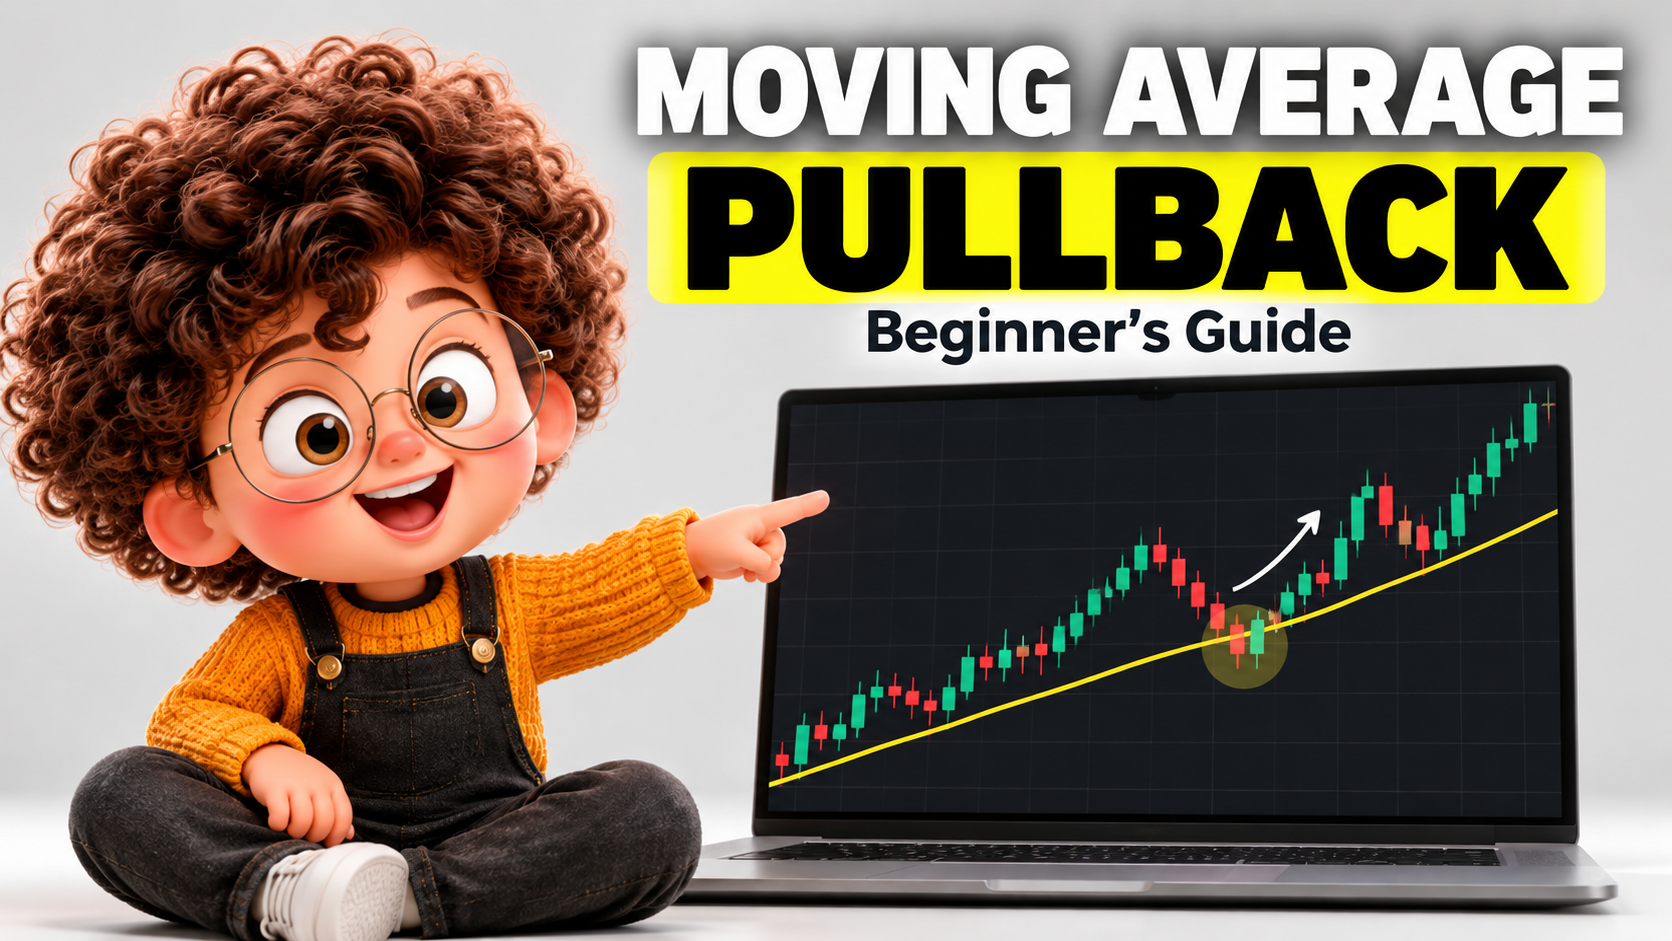
# Moving Average Pullback Trading: A Beginner's Guide
In the previous article, we explored golden crosses and death crosses to understand how moving averages can signal changes in market direction. But even when an upward trend develops, prices rarely move higher in a straight line.
A temporary decline during an uptrend is often called a pullback. Some pullbacks are followed by another upward move, while others develop into larger declines. This article explains how to observe pullbacks using moving averages, identify possible rebounds, and understand the risks involved.
1. What Is Moving Average Pullback Trading?
A pullback is a temporary price movement against an existing trend. During an uptrend, prices may decline before attempting to move higher again.
For example, imagine a market rising from 100 to 110, then falling to 105 before recovering to 112. The decline from 110 to 105 can be described as a pullback within the larger upward movement.
However, not every decline becomes a successful pullback. Some develop into a downward trend instead.
| Market condition | Price behavior | What to observe |
|---|---|---|
| Uptrend | Higher highs and higher lows | Whether the upward structure continues |
| Pullback | Price temporarily declines | How far and how quickly price falls |
| Rebound | Price begins recovering | Whether upward momentum returns |
| Trend weakness | Price breaks important previous lows | Whether the original trend remains valid |
The goal is not to buy every decline. It is to understand whether the existing trend may still be intact.
2. How to Identify Pullbacks on a Chart
① Set Up Two Moving Averages
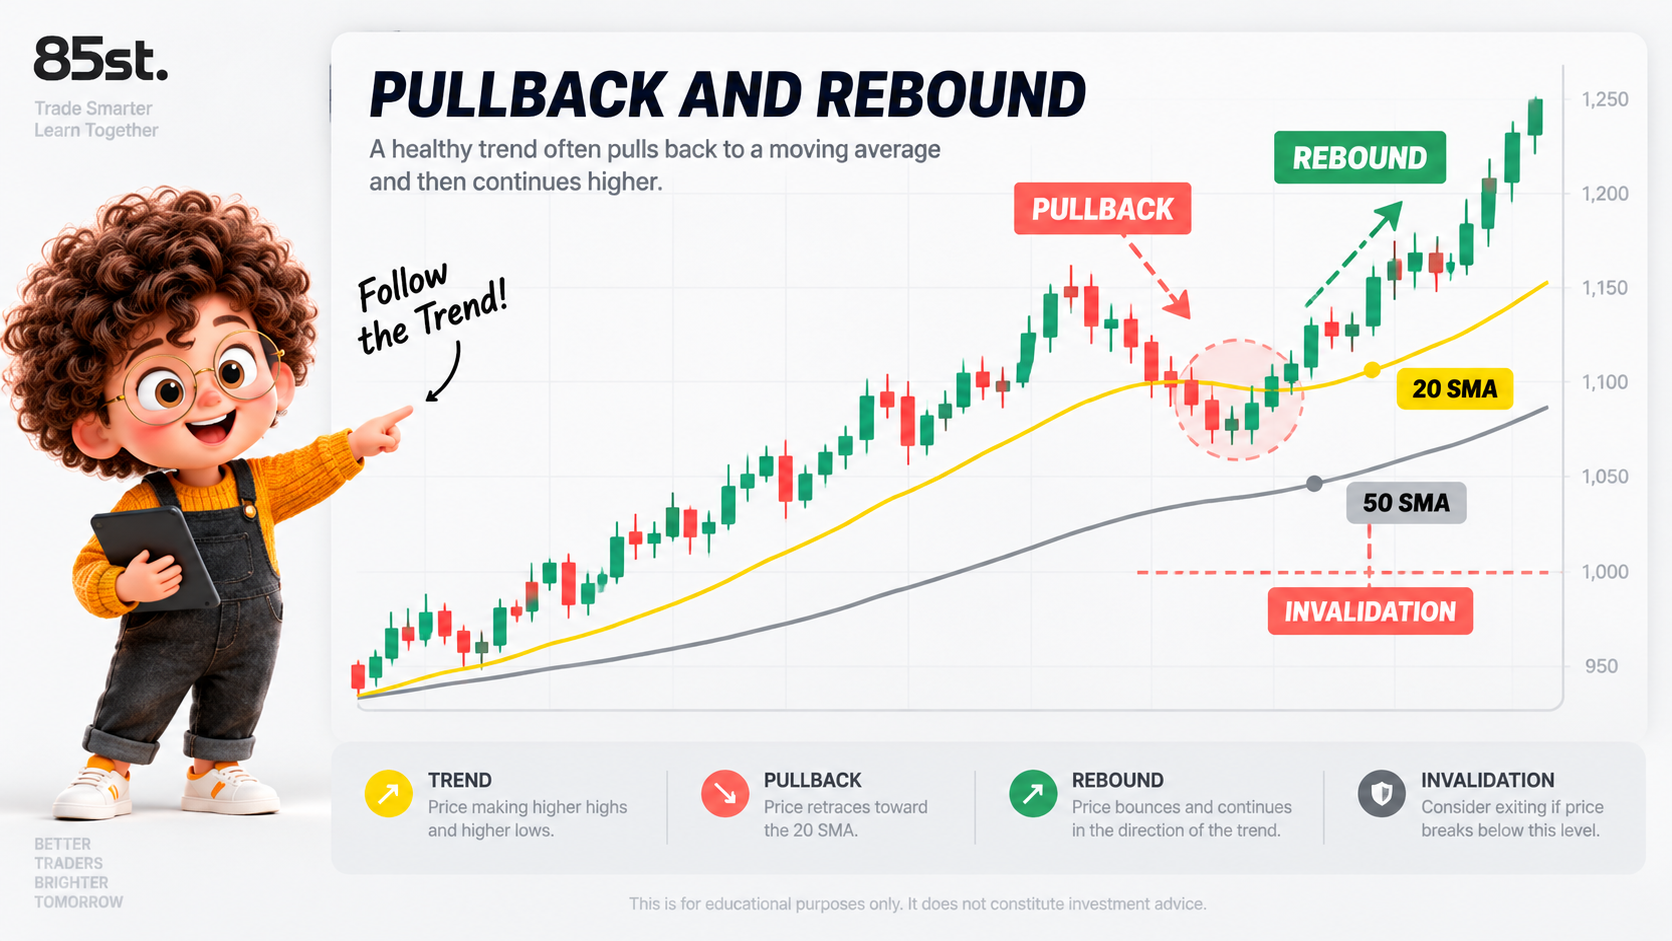
For practice, add a 20 SMA (yellow) and a 50 SMA (gray) to your chart.
The 20 SMA reflects the average closing price of the previous 20 candles, while the 50 SMA uses the previous 50 candles. These are educational settings, not optimized trading parameters.
② Identify the Existing Trend
When the 20 SMA is above the 50 SMA and both lines are rising, the chart may indicate an upward trend.
Also observe whether price continues to form higher highs and higher lows. Moving averages alone cannot confirm the strength or future direction of a trend.
③ Watch for a Pullback and Rebound
During an uptrend, price may temporarily decline toward the 20 SMA.
Instead of assuming the moving average will provide support, observe whether the price stabilizes and begins moving higher.
For example, you might wait for a completed rebound candle and then check whether price breaks above that candle's high.
A moving average is not a guaranteed support level. Price can cross below it, remain below it, or continue falling without rebounding.
3. Is Every Pullback a Trading Opportunity?
A pullback is one observation, not a complete trading signal. A temporary decline does not automatically justify entering a trade.
Before considering a setup, record the following information.
| Question | What to check |
|---|---|
| Is the trend still rising? | Whether moving averages and price structure remain upward |
| Is the decline controlled? | Whether price is holding above important previous lows |
| Has a rebound appeared? | Whether price shows recovery after the decline |
| Where would the setup fail? | A predefined level that invalidates the trade idea |
For example, you might record: "Price has pulled back toward the 20 SMA, but the rebound is weak and the previous low is under pressure."
This is more useful than simply writing "price touched the moving average—buy."
4. An Illustrative Pullback Trading Plan
The following is a fictional educational example. It demonstrates how a pullback might fit into a trading plan, not a proven strategy or a recommendation to trade.
① Define the Trend and Entry Conditions
Assume a market rises from 100 to 110 while the 20 SMA remains above the 50 SMA. Both moving averages are rising.
Price then declines toward the 20 SMA and reaches approximately 104.5.
Instead of entering immediately, the example waits for a rebound. If a completed rebound candle forms with a high of 106, an entry is considered only after price moves above that level.
Assume a hypothetical purchase is filled at 107.
If the rebound conditions do not occur, the plan produces no trade.
② Set the Stop and Target First
The example uses 103 as a stop reference, below the recent pullback low, and 115 as the target.
| Item | Fictional price |
|---|---|
| Buy fill | 107 |
| Stop reference | 103 |
| Target exit | 115 |
| Planned risk-to-reward ratio | 4 units of risk to 8 units of reward: 1:2 |
If price moves against the position, the stop is intended to limit the loss. If price reaches the target, the plan calls for an exit.
However, a planned 1:2 risk-to-reward ratio does not guarantee profitability. Actual results depend on trading costs, position size, contract specifications, execution, and the frequency of winning and losing trades.
③ Record Failed Setups
If price falls through the planned stop level, record the result according to the original rules.
Moving the stop farther away simply to avoid a loss changes the initial plan. Stop orders may also execute at prices different from the intended level, particularly during volatile conditions.
5. Why Pullback Trading Can Fail
A Pullback Becomes a Trend Reversal
A temporary decline may develop into a larger downward movement. If price repeatedly forms lower highs and lower lows, the previous upward-trend interpretation may no longer hold.
Moving averages are lagging indicators, meaning they are calculated from historical prices and may react after the market has already changed direction.
Sideways Markets and Sudden Volatility
When prices move within a narrow range, moving averages can flatten and produce misleading signals.
Unexpected economic announcements or market events can also cause sharp price movements, making planned entries and exits difficult to execute.
A trading plan should therefore include conditions for avoiding trades, not just conditions for entering them.
Key Takeaways
A pullback is a temporary decline within an existing trend. Moving averages can help traders observe these movements, but they cannot guarantee a rebound.
Check the direction of the trend, the position of the moving averages, and the behavior of price around previous highs and lows.
A complete trading plan should define entry conditions, stop levels, exit targets, and situations where no trade should be taken.
Frequently Asked Questions
Does Price Touching the 20 SMA Mean I Should Buy?
No. Price may rebound, move sideways, or continue falling. Touching a moving average does not confirm a trading opportunity.
Is the 20 SMA Better Than the 50 SMA for Pullback Trading?
There is no universally superior setting. Different markets and timeframes may produce different results. Use consistent parameters when comparing historical examples.
Can I Practice Pullback Trading in MT5?
Yes. MetaTrader 5 includes Moving Average indicators that can be added to charts. You can use historical data or a demo account to observe pullbacks and test predefined rules.
Next: Support and Resistance Explained
Why do prices repeatedly react around certain levels?
The next article introduces support and resistance, explains how to identify important price areas, and explores why those levels sometimes fail to hold.
Educational Purpose and Risk Disclosure
This article provides general information and education. It is not a recommendation to buy or sell a financial instrument or personalized investment advice. Fictional examples and technical indicators do not guarantee future returns.
Leveraged trading involves substantial risk. Depending on the product and applicable protections, losses may exceed the initial investment. Actual execution prices may differ from planned levels. Understand the structure, costs, and risks before trading. This disclosure does not exclude liability that cannot lawfully be excluded.