
9 Candlestick Patterns Made Easy: Essential Signals for Beginners
Learn 9 common candlestick patterns that beginners should know. This guide explains Hammer, Hanging Man, Shooting Star, Morning Star, Evening Star, and other key candlestick signals in simple terms.
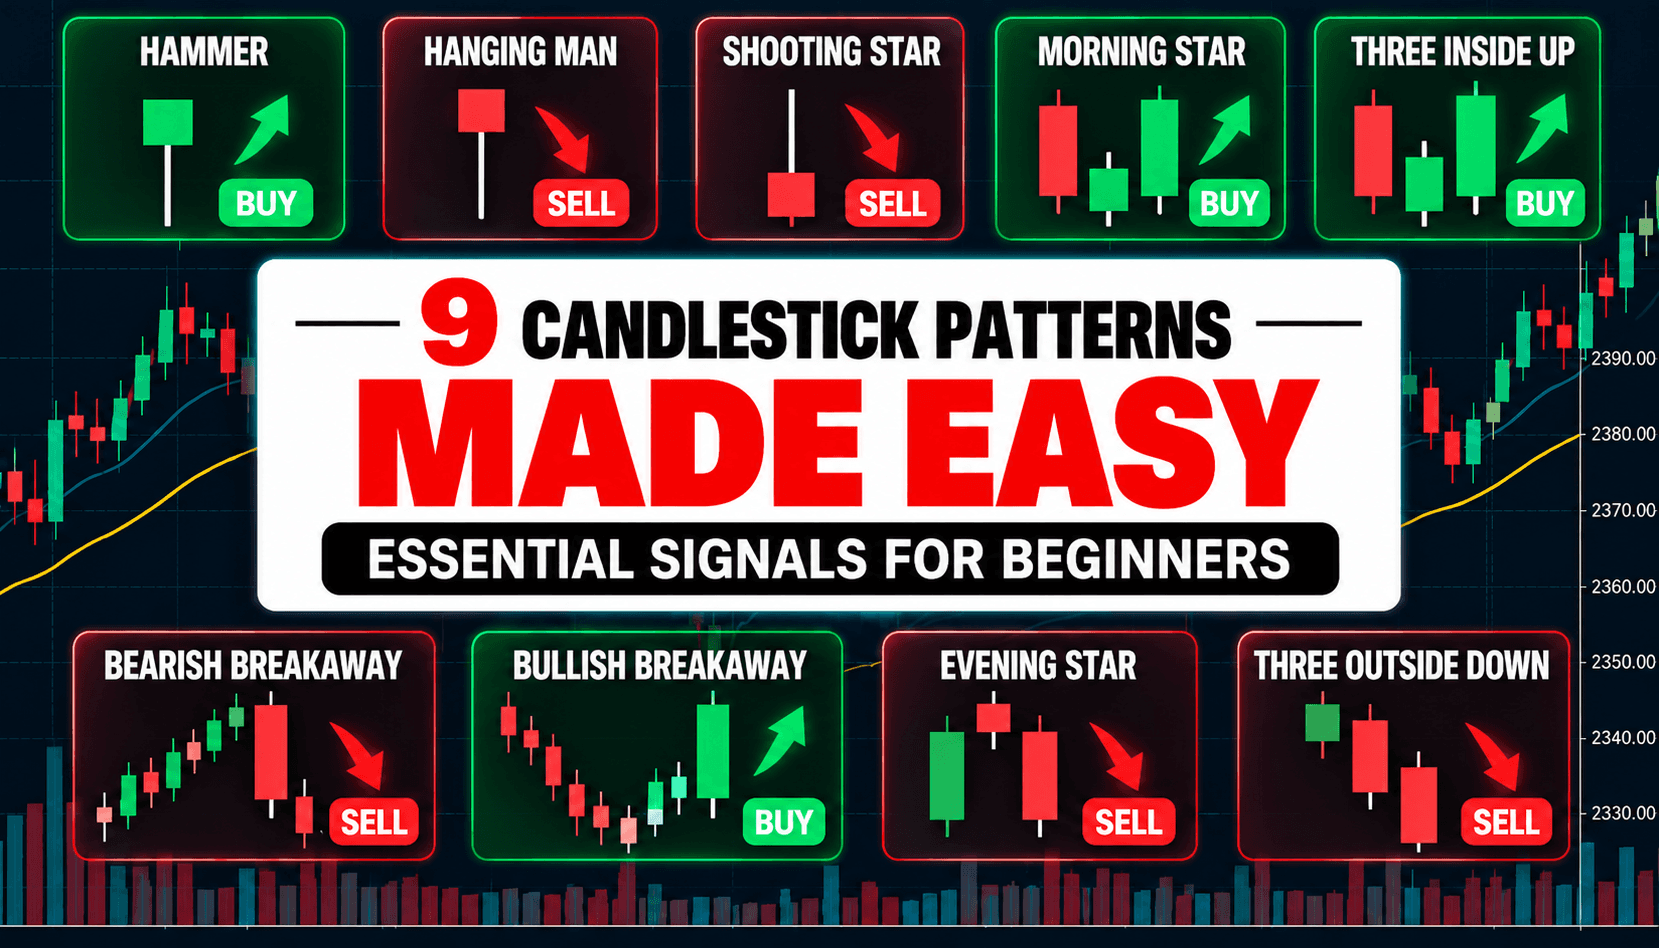
9 Candlestick Patterns Made Easy: Essential Signals for Beginners
When looking at a trading chart, you may notice that one candle or a group of candles sometimes forms a recognizable shape.
These are called candlestick patterns.
Candlestick patterns can help traders observe changes in buying and selling pressure, but a pattern does not guarantee that price will move in the expected direction.
In this guide, we will look at 9 common candlestick patterns that beginners may encounter.
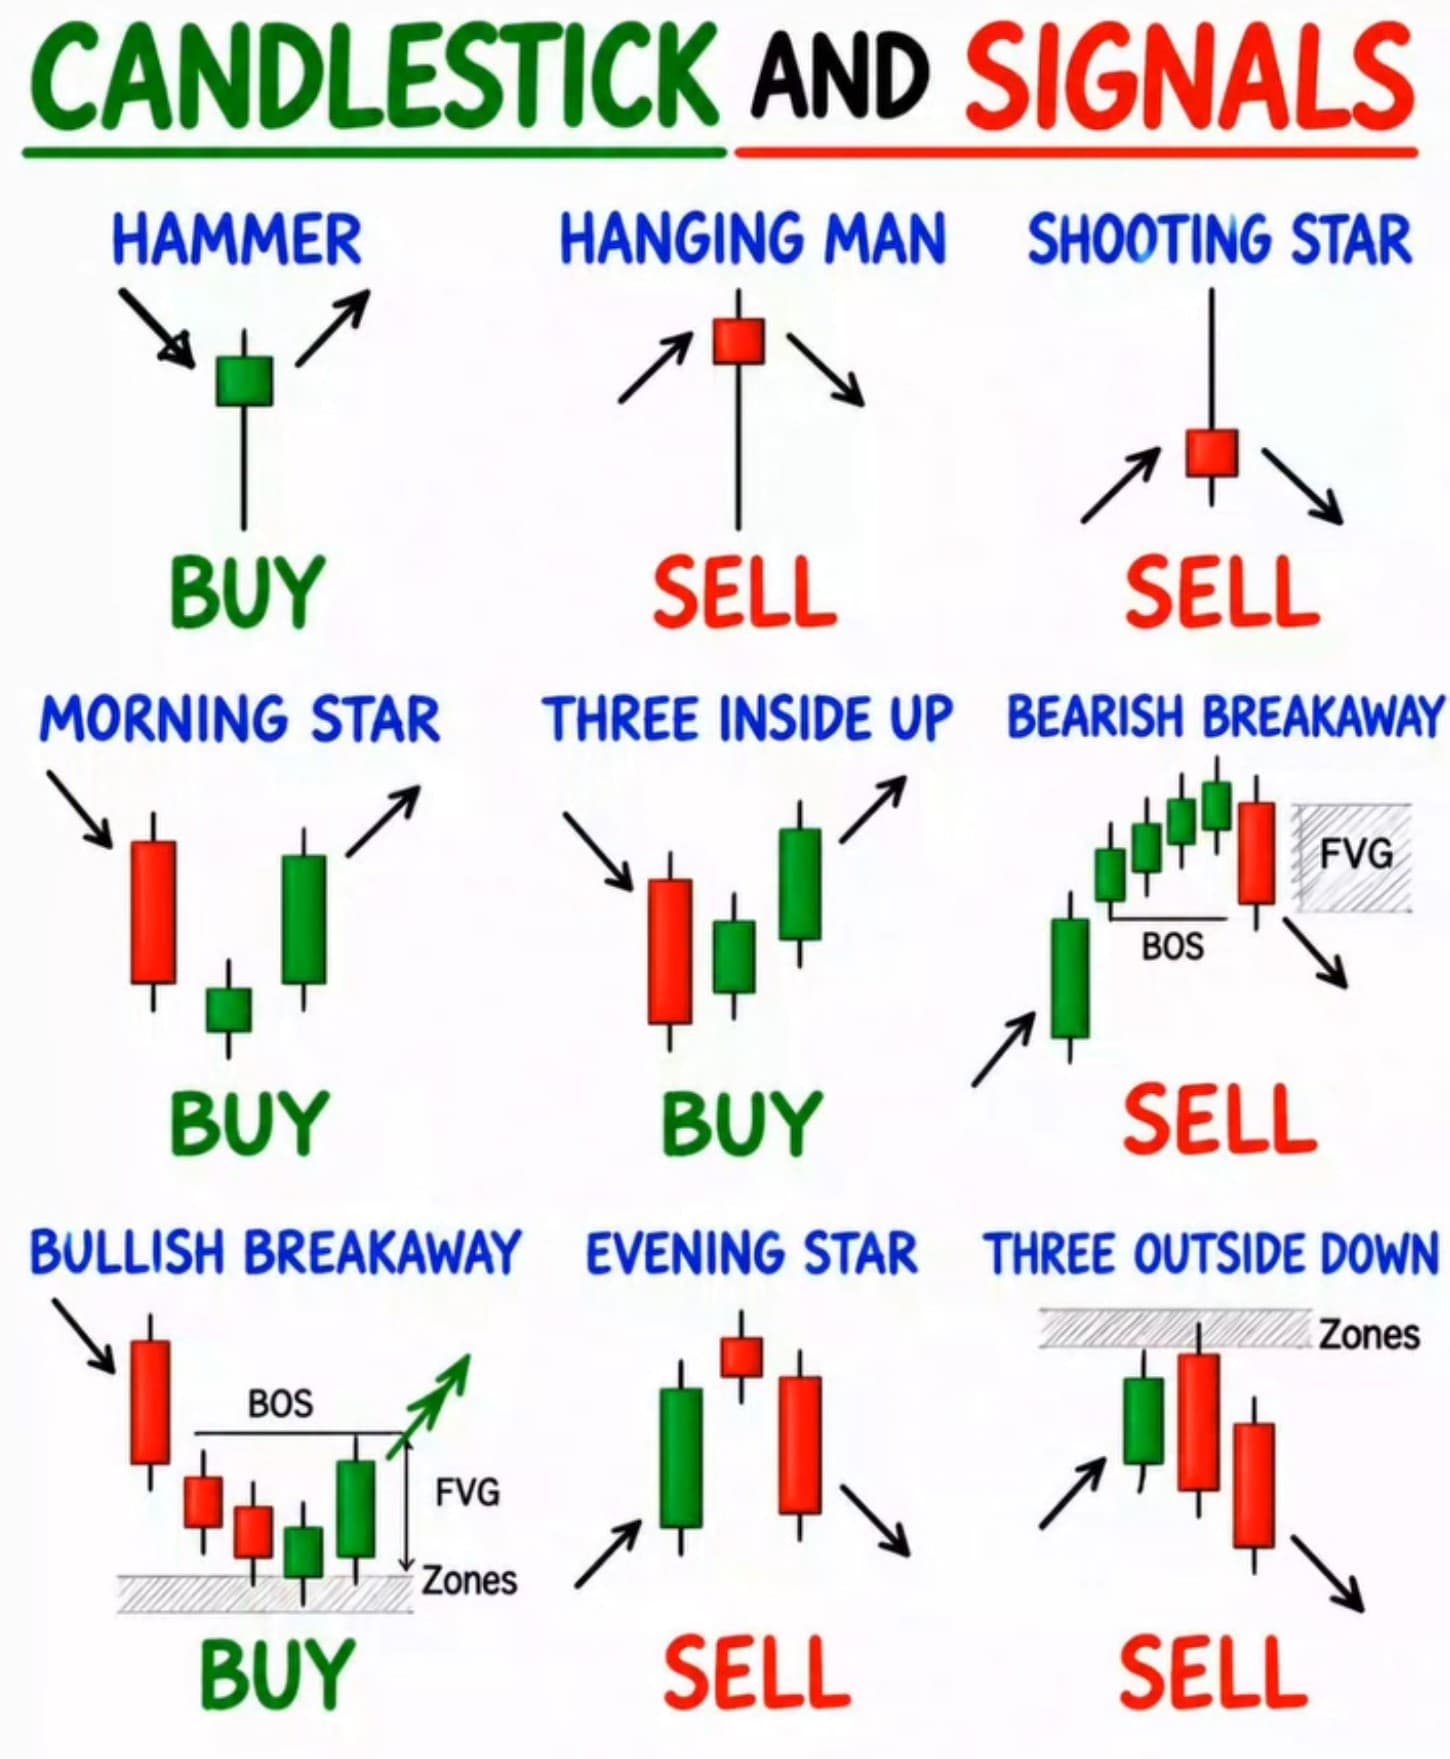
1. Hammer
Hammer
A hammer usually has a small body with a long lower wick.
It can show that price moved sharply lower but recovered before the candle closed.
When it appears after a decline or near a support area, traders may watch for signs that selling pressure is weakening.
However, a hammer by itself does not guarantee a reversal.
Advertisement · IC
2. Hanging Man
Hanging Man
The hanging man looks similar to a hammer, but it is usually observed after an upward move.
Price may fall sharply during the candle and then recover before the close.
When it appears near a high or resistance area, traders may watch for signs that the upward move is losing strength.
It is usually better to check the next candle for confirmation.
3. Shooting Star
Shooting Star
A shooting star usually has a small body with a long upper wick.
It shows that price moved higher but failed to hold those higher levels.
When it appears after an upward move or near resistance, traders may watch for weakening buying pressure.
4. Morning Star
Morning Star
A morning star is usually made up of three candles.
A strong bearish candle appears first, followed by a smaller candle, and then a strong bullish candle.
A simple way to understand it is:
Decline → Pause → Rebound
When it appears after a downtrend, traders may watch for a possible shift toward stronger buying pressure.
5. Three Inside Up
Three Inside Up
Three Inside Up is another three-candle pattern often associated with a possible bullish reversal.
A large bearish candle is followed by a smaller candle inside its range, and then a stronger bullish candle appears.
The final candle moving above the recent price area can be an important part of the pattern.
Simply seeing three candles with a similar shape does not automatically confirm the pattern.
6. Bearish Breakaway
Bearish Breakaway
This pattern describes a situation where an upward move begins to lose strength and stronger selling pressure appears.
If the existing price structure breaks downward, traders may watch to see whether bearish momentum continues.
Concepts such as BOS and FVG, which may appear in some illustrations, are separate market-structure concepts rather than standard candlestick patterns.
It is therefore useful to look at support, resistance, and overall market structure together with the candles.
7. Bullish Breakaway
Bullish Breakaway
Bullish Breakaway represents the opposite situation.
After a decline, selling pressure may weaken and a stronger upward move may begin.
If price breaks above nearby resistance or a recent market structure level, traders may watch for signs that bullish momentum is increasing.
However, one breakout does not guarantee that the trend has fully reversed.
8. Evening Star
Evening Star
The Evening Star is generally considered the opposite of the Morning Star.
A strong bullish candle appears first, followed by a smaller candle, and then a strong bearish candle.
A simple way to understand it is:
Rise → Pause → Decline
When it appears near a market high or resistance area, traders may watch for signs that buying pressure is weakening.
9. Three Outside Down
Three Outside Down
Three Outside Down is a multi-candle pattern that may appear after an upward move.
A strong bearish candle takes control after the market has moved higher, and the following candle continues lower.
This can suggest that selling pressure is becoming stronger than buying pressure.
The pattern may be more useful when it appears near resistance or around a previous market high.
What to Check When Using Candlestick Patterns
Candlestick patterns should not be judged only by their shape.
It is also useful to check:
- The trend before the pattern appeared
- Nearby support and resistance
- The next candle after the pattern
- Trading volume and volatility
- Important economic announcements
- Your stop-loss level
For example, instead of buying immediately after seeing a Hammer, you can first check whether it formed near support and whether the next candle actually moves higher.
Why BUY and SELL Labels Should Not Be Taken Literally
Some candlestick illustrations use simple BUY or SELL labels to make patterns easier to understand.
However, real markets are more complicated.
A Hammer can appear and price may still continue lower.
A Shooting Star can appear and price may continue higher.
A better way to think about the labels is:
BUY = Watch for possible bullish confirmation
SELL = Watch for possible bearish confirmation
Candlestick patterns are not automatic trading signals. They are tools for observing how price reacts.
Key Takeaways
The 9 candlestick patterns covered in this guide are:
- Hammer
- Hanging Man
- Shooting Star
- Morning Star
- Three Inside Up
- Bearish Breakaway
- Bullish Breakaway
- Evening Star
- Three Outside Down
The most important thing is not simply memorizing the names.
Try to understand the pattern in this order:
Previous trend → Pattern location → Confirmation candle
One-Line Summary
Candlestick patterns are not tools for predicting the future with certainty. They help traders observe changes in buying and selling pressure.
Instead of relying on the pattern alone, combine it with support, resistance, market structure, and confirmation from later price action.
Educational Purpose and Risk Disclosure
This article is provided for educational purposes and explains basic candlestick analysis. It is not a recommendation to buy or sell any financial instrument.
Candlestick patterns do not guarantee future price movements, and false signals can occur. Leveraged products can result in significant losses, so always consider position size, stop-loss levels, trading costs, and overall risk before trading.