
Support and Resistance Explained: A Beginner's Guide
Learn how to identify support and resistance levels, recognize breakouts and false signals, and understand risk management with simple trading examples.

# Support and Resistance Explained: How to Identify Key Price Levels
In the previous article, we explored how moving averages can help identify pullbacks and potential rebounds during an uptrend. But why do prices repeatedly rise or fall around certain levels?
When studying a chart, you may notice that prices often stop falling or rising near similar areas. These areas are commonly described using two important concepts: support and resistance.
This article explains what support and resistance mean, how to identify key price zones, what happens when these levels break, and how to include them in a fictional trading plan.
1. What Are Support and Resistance?
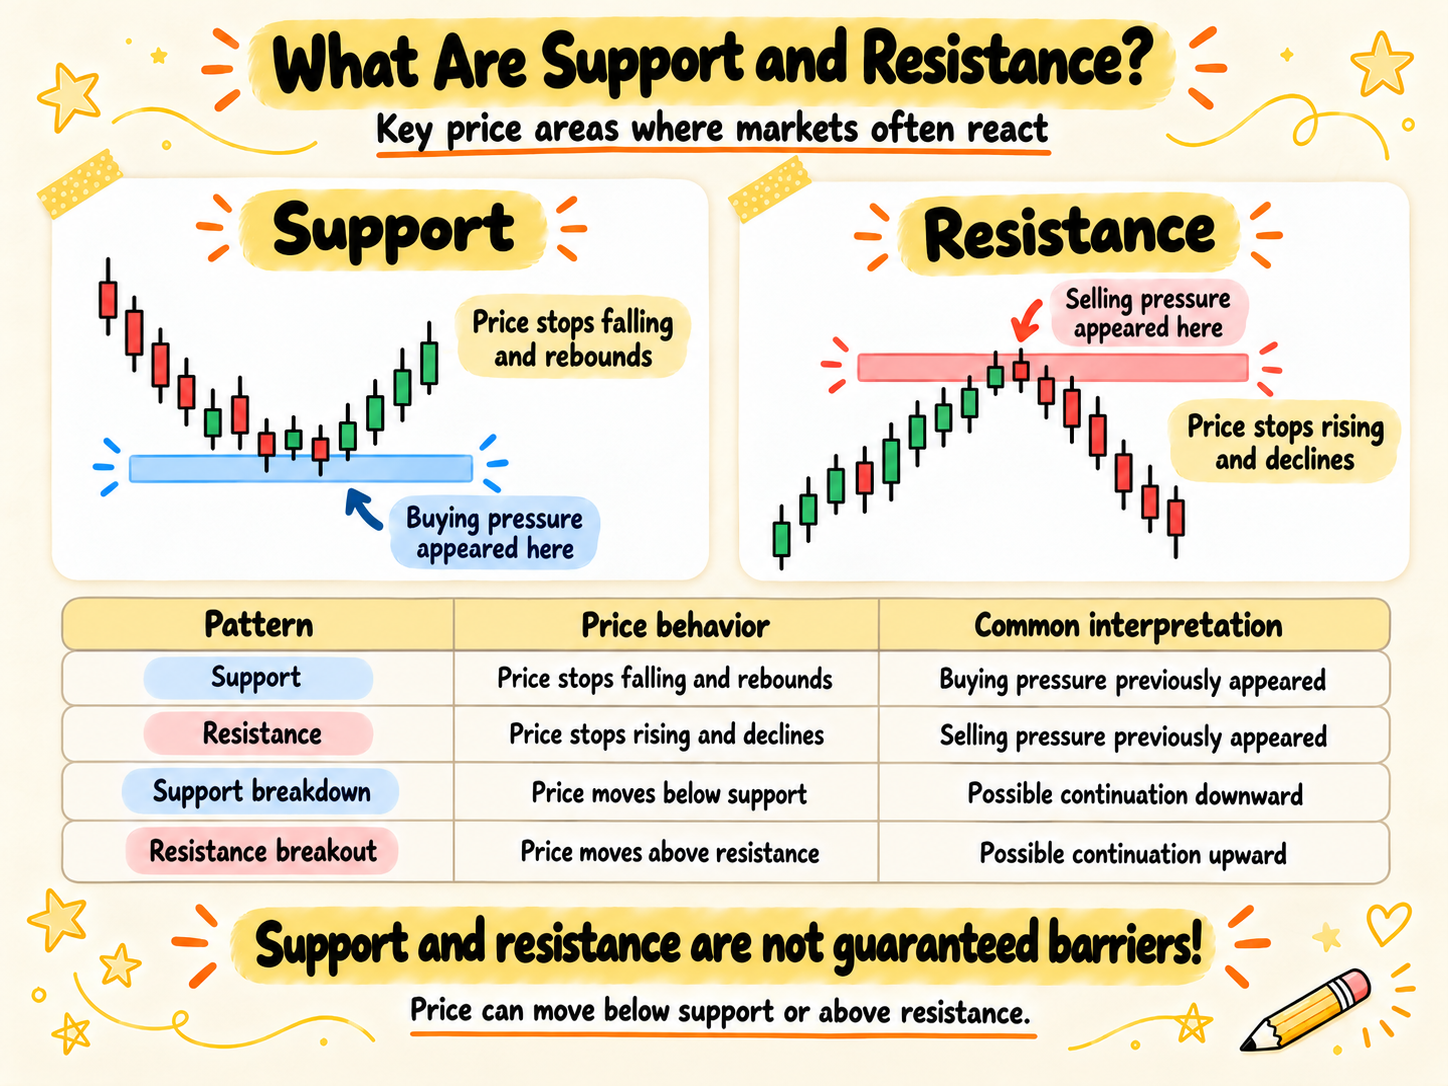
Support is a price area where buying pressure has previously been strong enough to slow or reverse a decline.
Resistance is a price area where selling pressure has previously slowed or reversed an upward movement.
For example, imagine a market that repeatedly rebounds around 100 and declines after reaching approximately 110.
In this situation, the area around 100 may be considered support, while the area around 110 may be considered resistance.
| Pattern | Price behavior | Common interpretation |
|---|---|---|
| Support | Price stops falling and rebounds | An area where buying pressure previously appeared |
| Resistance | Price stops rising and declines | An area where selling pressure previously appeared |
| Support breakdown | Price moves below support | Possible continuation of downward movement |
| Resistance breakout | Price moves above resistance | Possible continuation of upward movement |
However, support and resistance are not guaranteed barriers.
Prices can move below support or rise above resistance, sometimes with significant momentum.
2. How to Identify Support and Resistance on a Chart
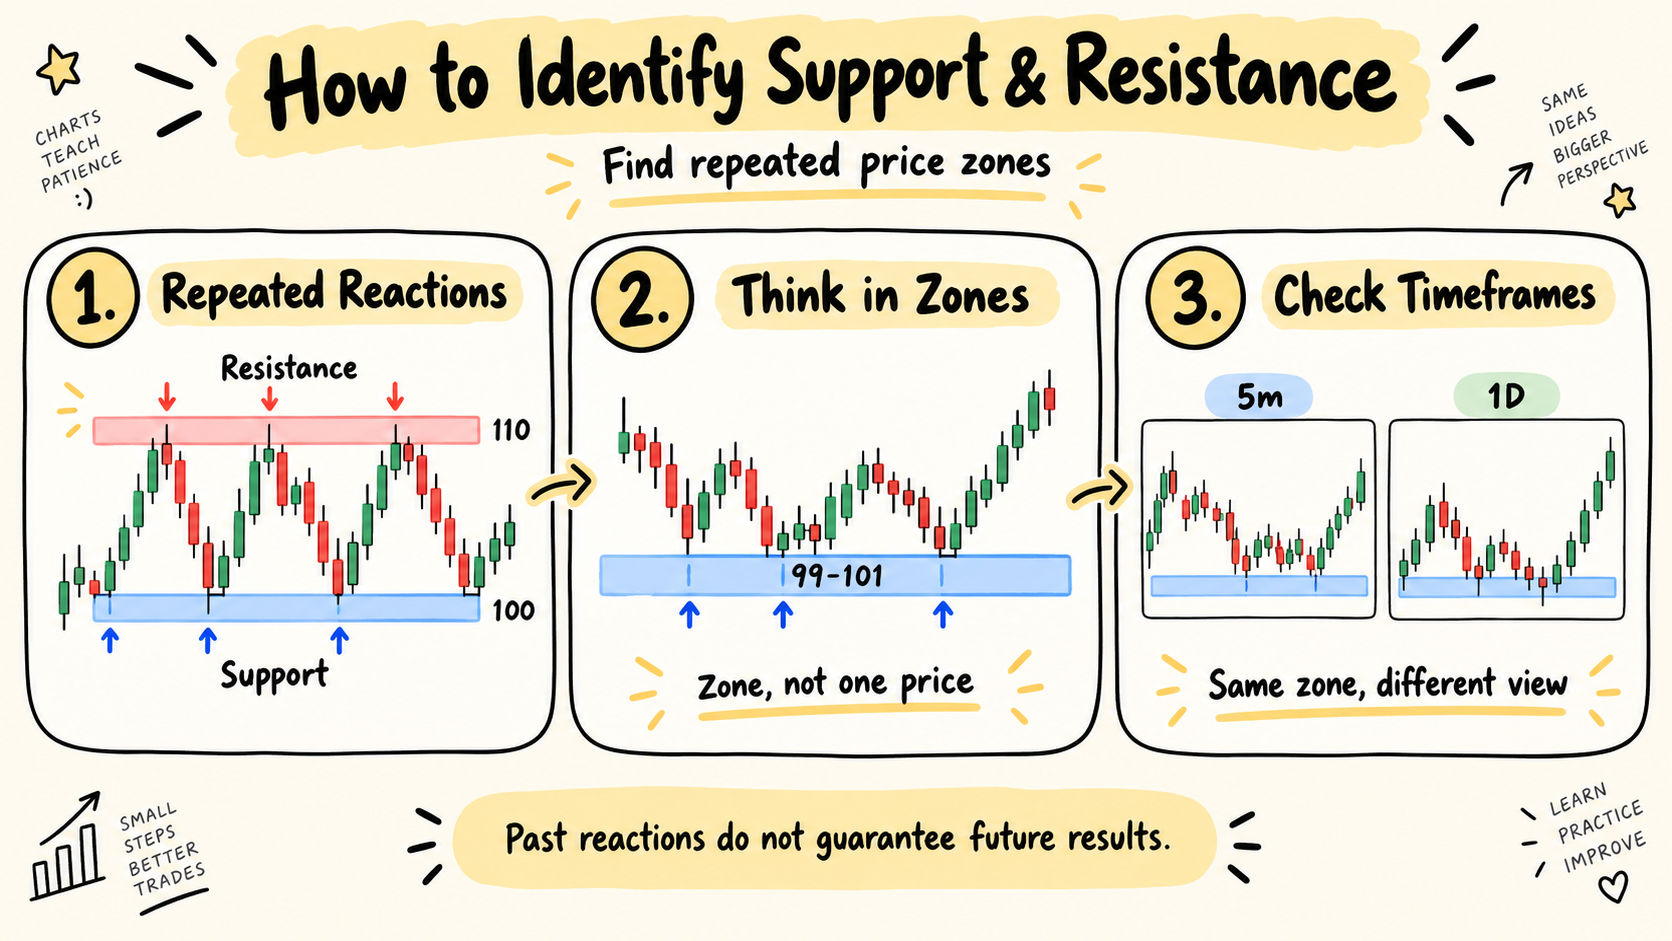
① Find Areas Where Price Reacts Repeatedly
Start by identifying price areas where the market has stopped falling or rising several times.
For example, if prices rebound around 100, 101, and 99.5, you might observe the area around 100 as a potential support zone.
Similarly, if upward movements repeatedly stop near 110, 109.5, and 111, that area may represent resistance.
② Think in Zones Rather Than Exact Prices
Support and resistance do not always occur at one precise price.
Market volatility and trading activity can cause prices to react slightly above or below previous levels.
Instead of focusing only on 100, it may be more useful to observe a range such as 99–101.
However, zones that are too wide can make trading decisions unclear. Consistent criteria are important.
③ Check Timeframes and Historical Reactions
The same price area may appear differently on a 5-minute chart compared with a daily chart.
Choose the timeframe you want to analyze and review how price previously behaved around important areas.
Remember that repeated historical reactions do not guarantee the same behavior in the future.
3. Can Support Become Resistance?
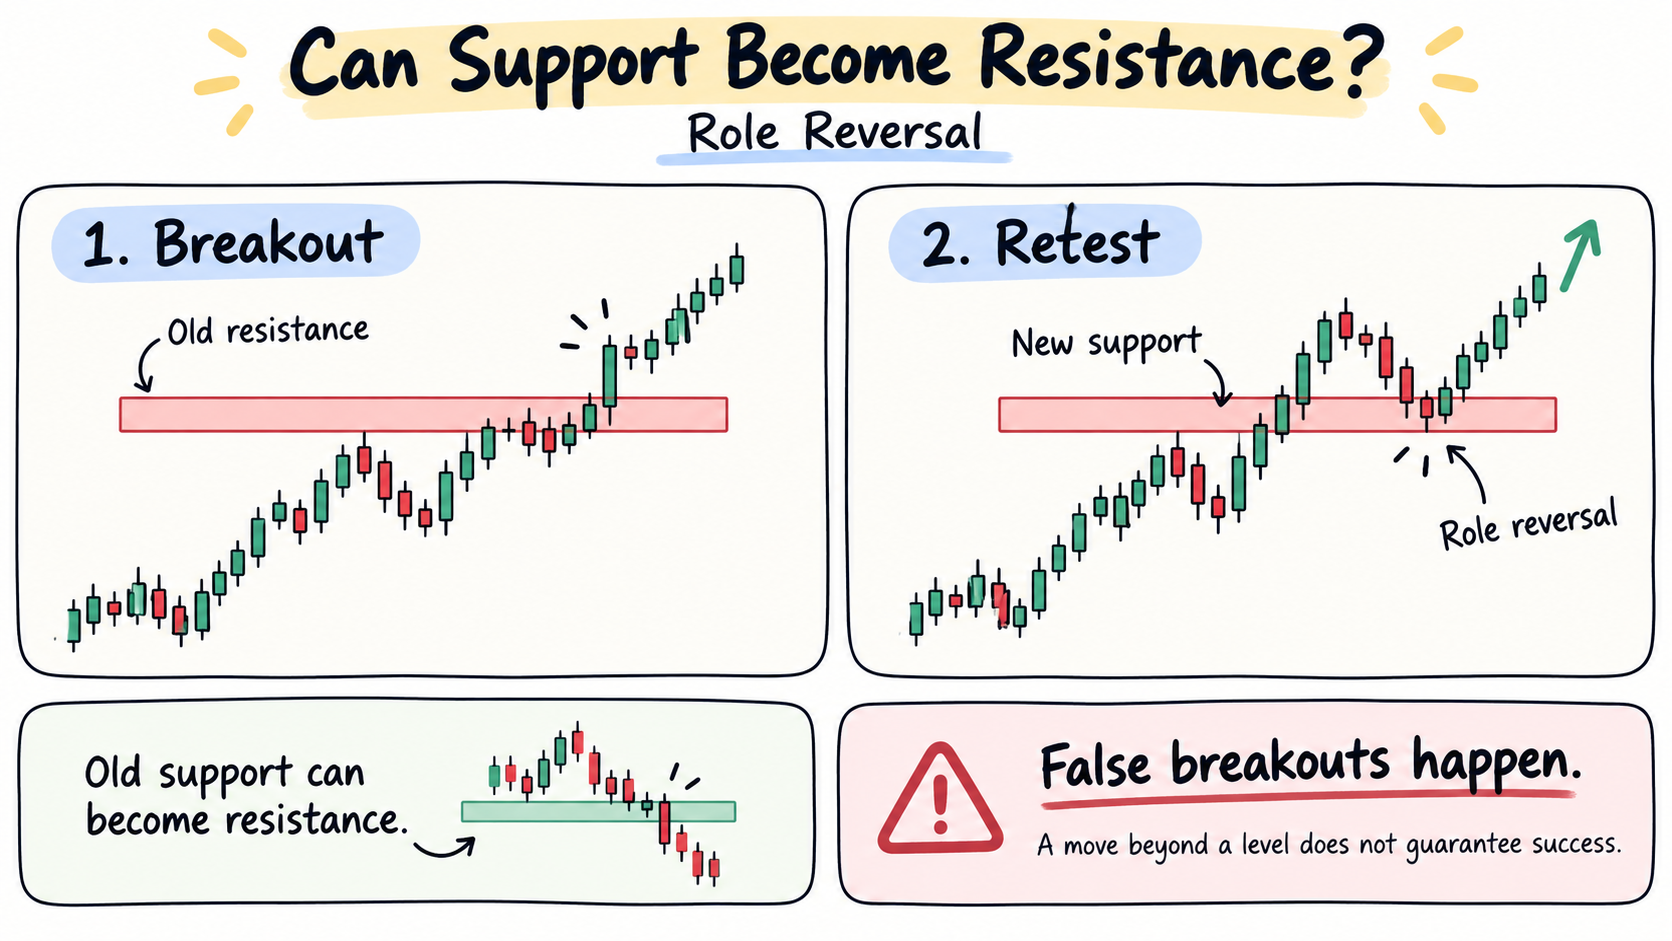
An important technical analysis concept is support and resistance role reversal.
Sometimes, when price breaks above a resistance zone and later returns to that area, the former resistance may act as support.
The opposite can also happen. After price breaks below support, the same area may act as resistance during a subsequent rebound.
| Market situation | What to observe |
|---|---|
| Resistance breakout | Price moves above the previous resistance zone |
| Pullback after breakout | Price returns toward the former resistance area |
| Support role reversal | Price attempts to rebound from the former resistance |
| Support breakdown | Price moves below the previous support zone |
| Resistance role reversal | A rebound struggles near the former support area |
However, moving briefly beyond a level does not confirm a successful breakout.
A false breakout occurs when price moves beyond a support or resistance level but then returns to its previous range.
Traders may observe whether price remains above or below a broken level, but even a confirmed candle close cannot eliminate false signals.
4. An Illustrative Support and Resistance Trading Plan
The following is a fictional educational example showing how support and resistance might fit into a trading plan. It is not a live recommendation or a strategy with verified profitability.
① Identify Support and Entry Conditions
Assume a market has repeatedly rebounded near 100 and struggled to rise above 110.
For this example, we identify:
- Support zone: 99–101
- Resistance zone: 109–111
Instead of entering immediately when price reaches 100, the plan waits for signs of a rebound.
Assume the predefined confirmation conditions occur and a hypothetical purchase is filled at 102.
If price fails to rebound or breaks below the support zone, the plan produces no trade.
② Set the Stop and Target First
The example places a stop reference at 99, below the support area, and a target at 108, before the resistance zone.
| Item | Fictional price |
|---|---|
| Buy fill | 102 |
| Stop reference | 99 |
| Target exit | 108 |
| Planned risk-to-reward ratio | 3 units of risk to 6 units of reward: 1:2 |
If price declines toward 99, the plan calls for an exit to limit the loss.
If price rises toward 108, the plan considers closing the position near the target.
However, a planned 1:2 risk-to-reward ratio does not guarantee profitability.
Actual trading results depend on position size, contract specifications, spreads, commissions, execution prices, and the frequency of successful and unsuccessful trades.
③ Record Unexpected Outcomes
If price fails to rebound and continues falling, record the unsuccessful setup.
If the stop condition is reached after entry, record the outcome according to the original trading rules.
Continuously moving a stop farther away or creating new support levels simply to avoid accepting a loss changes the original trading plan.
5. Why Support and Resistance Analysis Can Fail
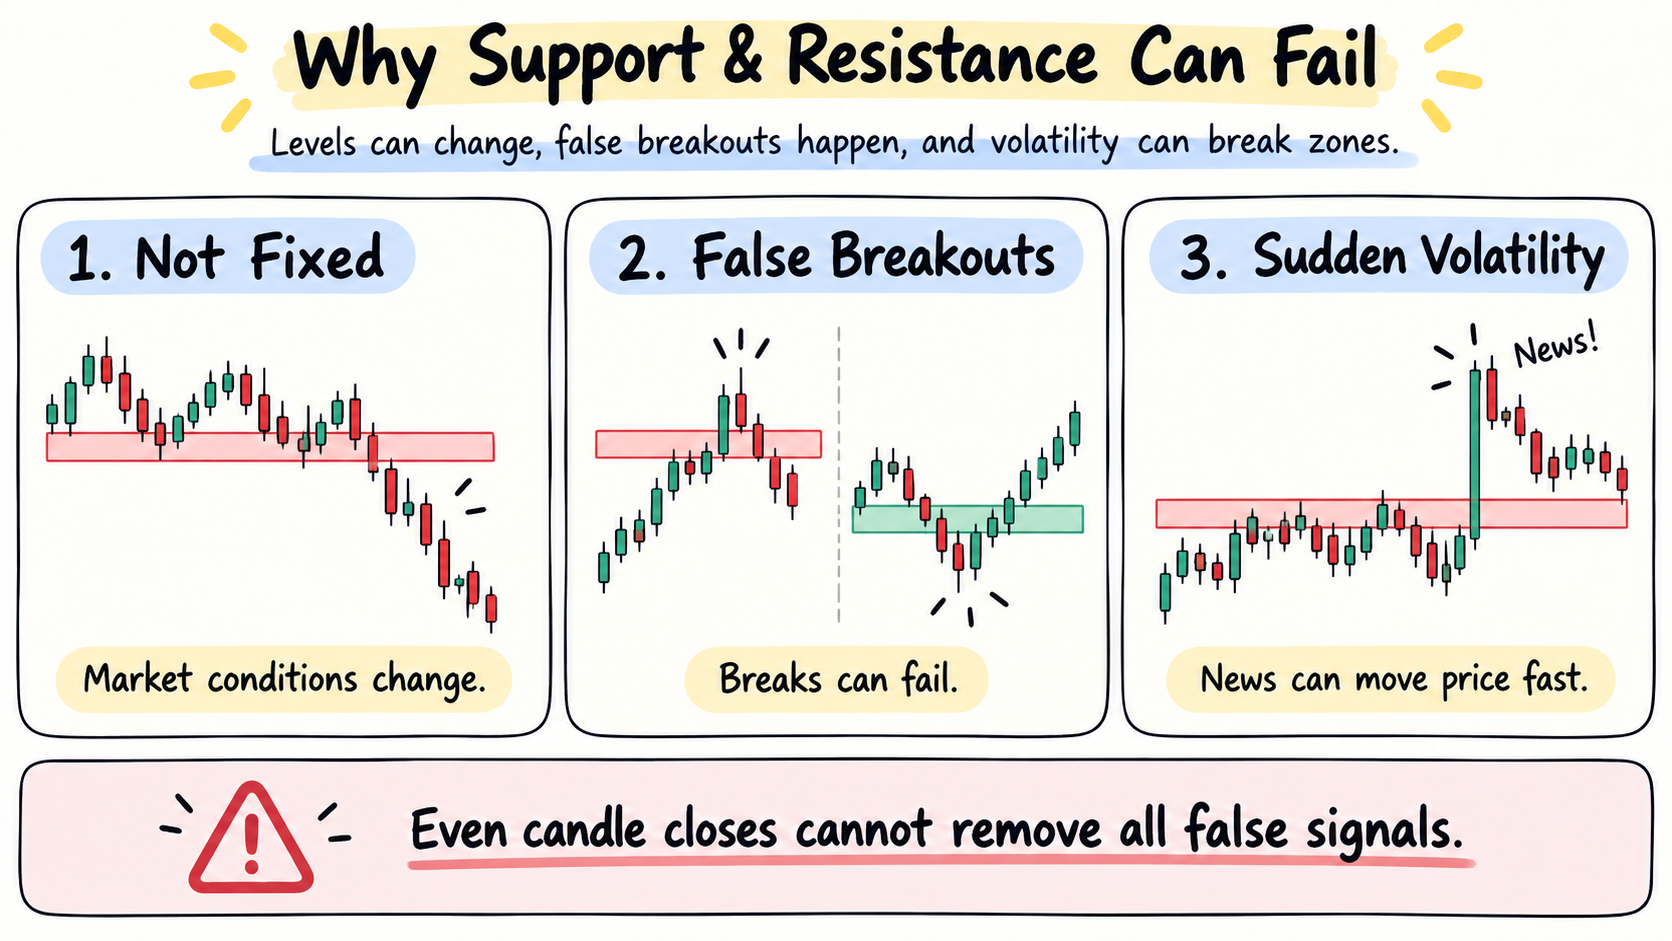
Support and Resistance Are Not Fixed Prices
Market conditions change, and historical support or resistance areas may no longer influence prices in the same way.
Strong upward or downward movements can push prices rapidly through previously important levels.
False Breakouts Can Occur
Price may briefly break above resistance before falling back below it.
Similarly, price can move below support and then recover quickly.
Waiting for a candle to close may provide a more consistent observation, but it cannot completely prevent false breakout signals.
Unexpected Market Volatility
Important economic announcements or unexpected market events can cause sudden price movements.
During these periods, support and resistance zones may fail to behave as expected.
Stop-loss orders may also execute at prices different from their specified levels, so execution risk and trading costs must be considered.
Key Takeaways
Support is an area where prices have previously stopped falling and rebounded. Resistance is an area where prices have previously stopped rising and declined.
These concepts help identify potentially important price areas, but they cannot predict future movements with certainty.
Think in price zones rather than exact levels, and evaluate historical reactions alongside the current market trend.
A complete trading plan should include entry conditions, stop-loss rules, exit targets, and situations where no trade should be taken.
Frequently Asked Questions
Does Price Always Rebound From Support?
No. Price can break below support and continue falling. Previous rebounds do not guarantee future support.
How Many Times Should Support or Resistance Be Tested?
There is no fixed number of required tests. Repeated reactions may help identify important areas, but additional tests do not guarantee that a level will hold.
Should I Buy Immediately After a Resistance Breakout?
A breakout alone is not enough to justify a trade. Consider whether price maintains the breakout, the possibility of false signals, predefined risk limits, and trading costs.
Can I Draw Support and Resistance in MT5?
Yes. MetaTrader 5 provides chart drawing tools, including horizontal lines, that can help traders identify and observe important price areas.
Next: Support and Resistance Breakout Trading
What happens when price breaks through a resistance level that has held for a long time?
The next article explores breakout trading, how to observe pullbacks after breakouts, and why false breakouts require careful risk management.
Educational Purpose and Risk Disclosure
This article provides general information and education. It is not a recommendation to buy or sell a financial instrument or personalized investment advice. Fictional examples and technical analysis do not guarantee future returns.
Leveraged trading involves substantial risk. Depending on the product and applicable protections, losses may exceed the initial investment. Market volatility can cause actual execution prices to differ from planned levels. Understand the structure, costs, and risks before trading. This disclosure does not exclude liability that cannot lawfully be excluded.